Machine learning has a credibility problem in wind finance. A method can be more accurate on paper and still be rejected by a technical advisor who cannot see inside it. So before emcipy goes near a bankable report, it has to clear a higher bar than accuracy alone: the results have to be reproducible, out-of-sample, and benchmarked against the methods the industry already trusts.
This note sets out exactly how we test it, and what the numbers say.
01What emcipy has to prove
Measure-correlate-predict reconstructs a long-term wind signal at a site from a short on-site campaign and a long reference series. The established families, linear regression and variance-ratio methods, are transparent and widely accepted, but they typically work on hourly data and treat each direction sector with a single linear relationship.
emcipy uses gradient-boosted models to reconstruct speed, direction, temperature, pressure and turbulence; the algorithm runs natively on 10-minute data, with seasonality and sector-dependent behaviour built in. That extra flexibility is only worth having if it survives two tests:
- Generalisation. Does it stay accurate on data it has never seen, across many different sites, not just the one it was tuned on?
- No penalty versus the incumbents. Does it match or beat the linear methods an advisor recognises, on both the wind speed signal and the energy yield that actually drives a valuation?
And it has to be auditable. The temperature and pressure adjustments are ordinary linear regressions, fully transparent. The speed and direction models are gradient-boosted, but their predictors are explicit and physical: the long-term reference speed and direction, hour of day, and month. Seasonality and the diurnal cycle are inputs the model is told to use, not latent factors it invents, so their effect can be read directly from feature importance and partial-effect plots. The reconstruction is interrogable rather than a closed box, which is the condition for a technical advisor to sign off on it.
02The backtest protocol
The headline numbers come from a fleet-wide hold-out backtest. For every measurement series, emcipy is trained on one part of the record and scored only on a portion it never saw during training. Performance is measured against the recorded mast data, not against a reanalysis proxy, so the reference is ground truth rather than another model.
We run this across the whole fleet rather than a showcase site:
- 34 projects, 151 measurement series, spanning onshore, offshore and nearshore conditions.
- Heights from 40 to 200 m, so the test covers modern hub heights, not just met-mast levels.
- Four metrics reported as a distribution (median plus the P10 to P90 spread), so a single lucky or unlucky site cannot carry the story.
Out-of-sample metrics: R² (centred, traditional), RMSE (m/s), MAE (m/s), MAPE (%). Quality control: series with parsed heights outside 40 to 200 m are excluded as file-naming artefacts before scoring.
03Headline results
Across 151 series, the median out-of-sample R² is 0.946, with 80% of all series falling between 0.880 and 0.975. The reconstruction explains the overwhelming majority of the measured variance at the typical site, and the weak tail is shallow.
All metrics are computed at emcipy's native 10-minute time step, the resolution it produces, not resampled to hourly. The reconstruction is scored at the resolution it generates.
| Metric | Median (P50) | P10 | P90 |
|---|---|---|---|
| R² (hold-out) | 0.946 | 0.880 | 0.975 |
| RMSE (m/s) | 0.889 | 0.723 | 1.175 |
| MAE (m/s) | 0.601 | 0.506 | 0.854 |
| MAPE (%) | 5.78 | 3.11 | 12.19 |
Those are wind-speed metrics. What a lender ultimately prices is energy. Translated into production and run through a commercial energy model, the same reconstruction also leads the linear methods on the hourly energy signal. That head-to-head is in section 06.
04Robustness: it holds across sites and heights
A strong median is only reassuring if it does not hide a class of sites where the method falls apart. Two cuts of the same backtest address that directly.
By site type. Split into onshore, offshore and nearshore series, R² and RMSE stay inside the same band. No site class is quietly carrying the headline figure, and none is dragging it down. The method does not depend on a particular wind climate to look good.
By height. Plotted against measurement height, out-of-sample R² is flat from 40 to 200 m. The reconstruction does not degrade as it extrapolates toward modern hub heights, which is exactly where the bankable answer lives. The per-type and per-height breakdowns are included in the validation dossier.
05Turbulence, not just wind speed
A reconstruction that stops at wind speed is only half a site assessment. Turbulence intensity drives turbine class selection, fatigue loading and, above all, wake behaviour inside the array. A bankable answer cannot leave it out.
emcipy reconstructs turbulence intensity at the same 10-minute resolution as the wind speed, sector by sector and wind-speed bin by wind-speed bin, across the full long-term period. It also rebuilds turbulence where the instrument cannot deliver it cleanly: a floating LiDAR's own motion contaminates the measured turbulence, and the model corrects for that bias rather than passing it through.
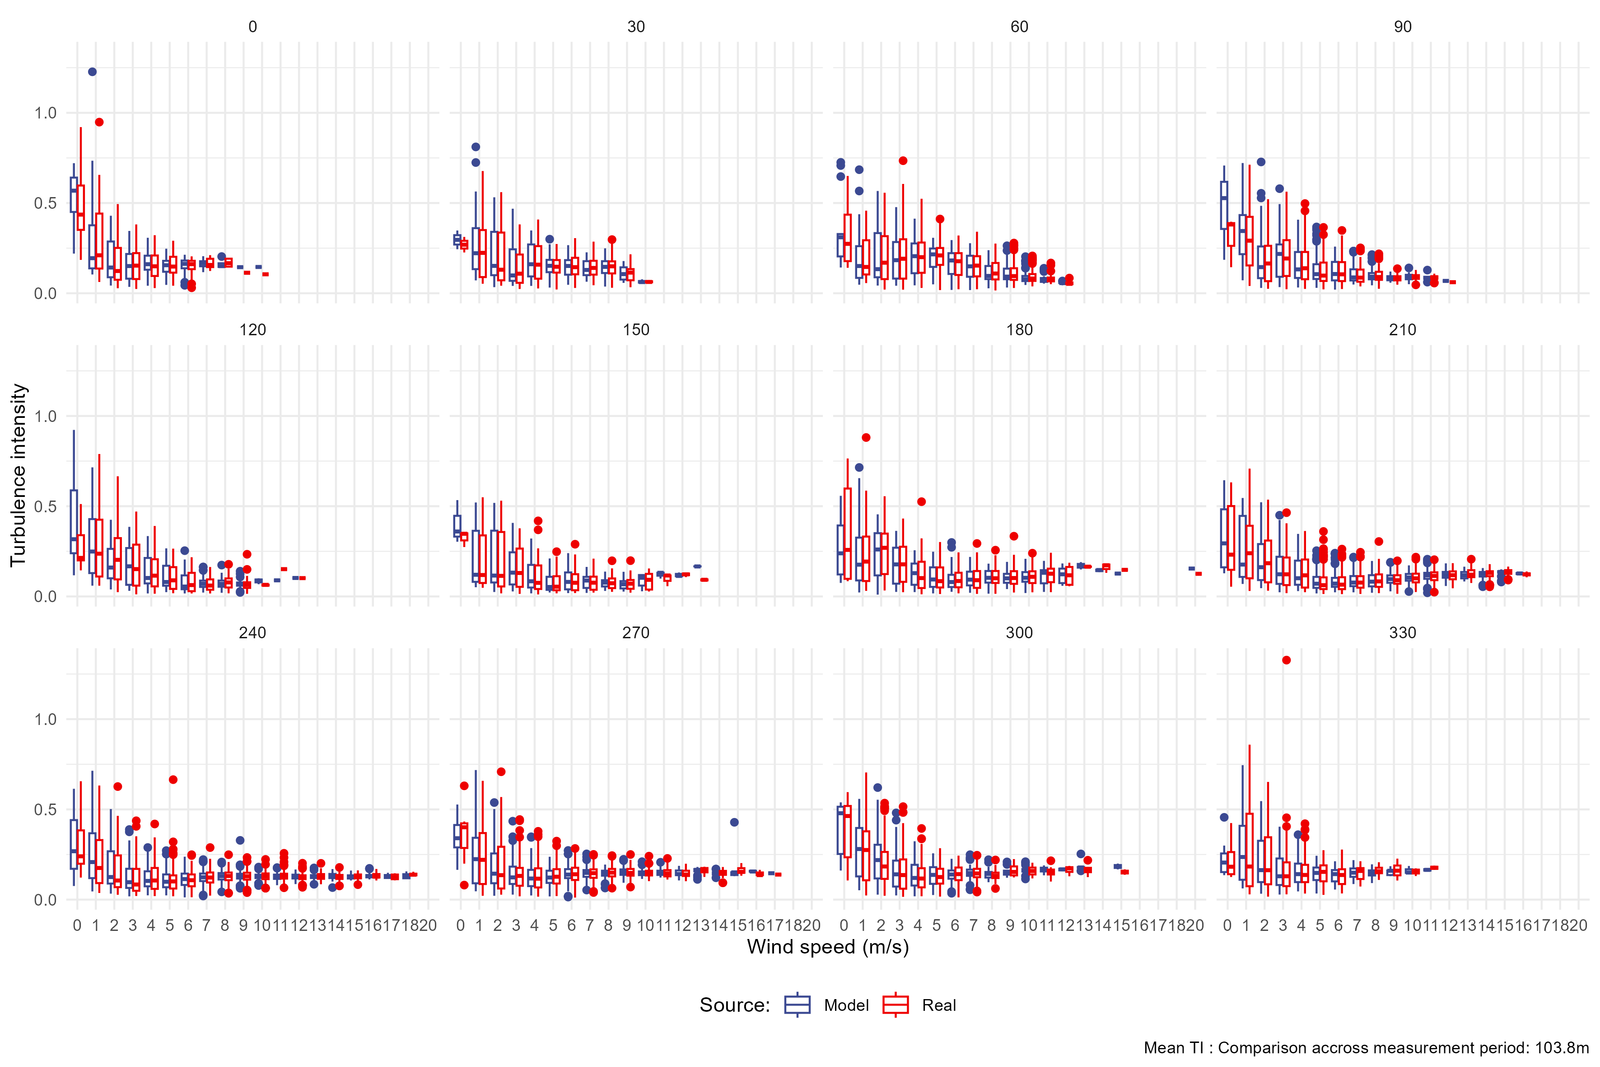
This matters beyond accuracy for its own sake. Site suitability under IEC 61400-1, the fatigue loads that set component lifetimes, and the wake-added turbulence that governs array losses all depend on a credible turbulence input. A long-term, sector-resolved turbulence reconstruction closes a gap that a speed-only MCP leaves open.
06Head to head against established MCP methods
Accuracy against measurements is necessary but not sufficient. The question a technical advisor asks is sharper: does the model do anything the trusted linear methods could not? To answer it on equal terms, we run emcipy and the established families on the same site, against the same measured reference, and compare them on two planes.
Plane one: the wind speed signal
emcipy is benchmarked against the standard MCP families, scored on R², RMSE and MAE, on the reconstructed distribution overall and sector by sector, and on the resulting wind rose. This is where the 10-minute, sector-aware reconstruction shows its value: it reproduces the shape of the distribution and the directional behaviour, not just the mean.
Under the hood, emcipy regresses each physical variable on its own: temperature, pressure, wind speed and the wind-speed standard deviation (the basis for turbulence intensity). Wind direction is reconstructed from its vector components (the u and v wind vectors) rather than corrected by a single per-sector bias, so veer and directional shear are reproduced instead of flattened.
Reference methods, named by family rather than by tool: OLS regression, Variance ratio, Matrix method. emcipy is compared against all three, plus the long-term reference, on identical synchronised data.
Plane two: the energy yield
Speed metrics matter, but a lender is paid back from energy. To compare on the terms the industry uses, emcipy's 10-minute output is aggregated to hourly and run through the same commercial energy model (OpenWind) as every other method, then scored hour by hour against the measurement-driven production.
The four methods line up as follows. R² and the hourly error are computed against measurement; the hourly error is shown relative to emcipy (1.00×), so it reads without needing the site's production scale.
| Method | R² (hourly energy) | Hourly RMSE (× emcipy) |
|---|---|---|
| emcipy | 0.921 | 1.00× |
| OLS regression | 0.802 | 1.59× |
| Variance ratio | 0.797 | 1.61× |
| Matrix method | 0.745 | 1.80× |
emcipy reconstructs the hourly production signal at R² 0.92, against 0.75 to 0.80 for the linear families, and cuts the hourly error by roughly 40%: each linear method carries 1.6 to 1.8 times emcipy's RMSE.
Scope: this head-to-head is a single project, scored on hourly energy fidelity over the concurrent campaign, distinct from the 151-series wind-speed backtest in section 03. A proper multi-year AEP comparison over full 8766-hour annual cycles is a separate exercise, in progress. Read these figures as relative behaviour between methods, not as an annual-energy statistic.
What the comparison establishes
Held to the same measured reference as the methods an advisor already accepts, emcipy leads on hourly energy fidelity (R² 0.92 versus 0.75 to 0.80). The per-method detail, the wind-rose and sector comparisons, and the underlying production runs form the body of the validation dossier, available on request for technical due diligence.
07What this does, and does not, claim
The point of publishing a method note is to be precise about its limits, because that is what makes the strong results believable.
- It is out-of-sample and fleet-wide. Every figure is scored on data held out of training, across 151 series, not on the data the model was fitted to.
- The metrics are named honestly. R² is the standard centred coefficient. The through-origin slope, where we use it as a bias indicator, is reported separately and never relabelled as R².
- A backtest is not a guarantee. It bounds expected error on sites like those tested. For any individual project, the next layer is explicit uncertainty: P50 and P90 with prediction intervals, which is a deliverable in its own right, not an afterthought.
The honest bottom line
A gradient-boosted reconstruction does not get a pass for being clever. emcipy earns its place by reconstructing the wind to better than 0.9 R² out-of-sample at the typical site, holding that across site type and height, and leading the linear methods on the hourly energy signal, while adding 10-minute resolution they cannot offer.
And it is not limited to greenfield resource assessment. We apply the same engine to operational SCADA data analysis, where it reconstructs a cleaner, gap-filled long-term production signal for assets already in the ground. That makes emcipy directly useful for portfolio acquisition due diligence and repowering studies, where a more accurate long-term estimate on existing assets is what drives the valuation.
Request the full validation dossier
The complete methodology, the per-method comparison and the energy-yield analysis are available for technical review.
Request the validation dossier →